Power BI · DAX · Power Query
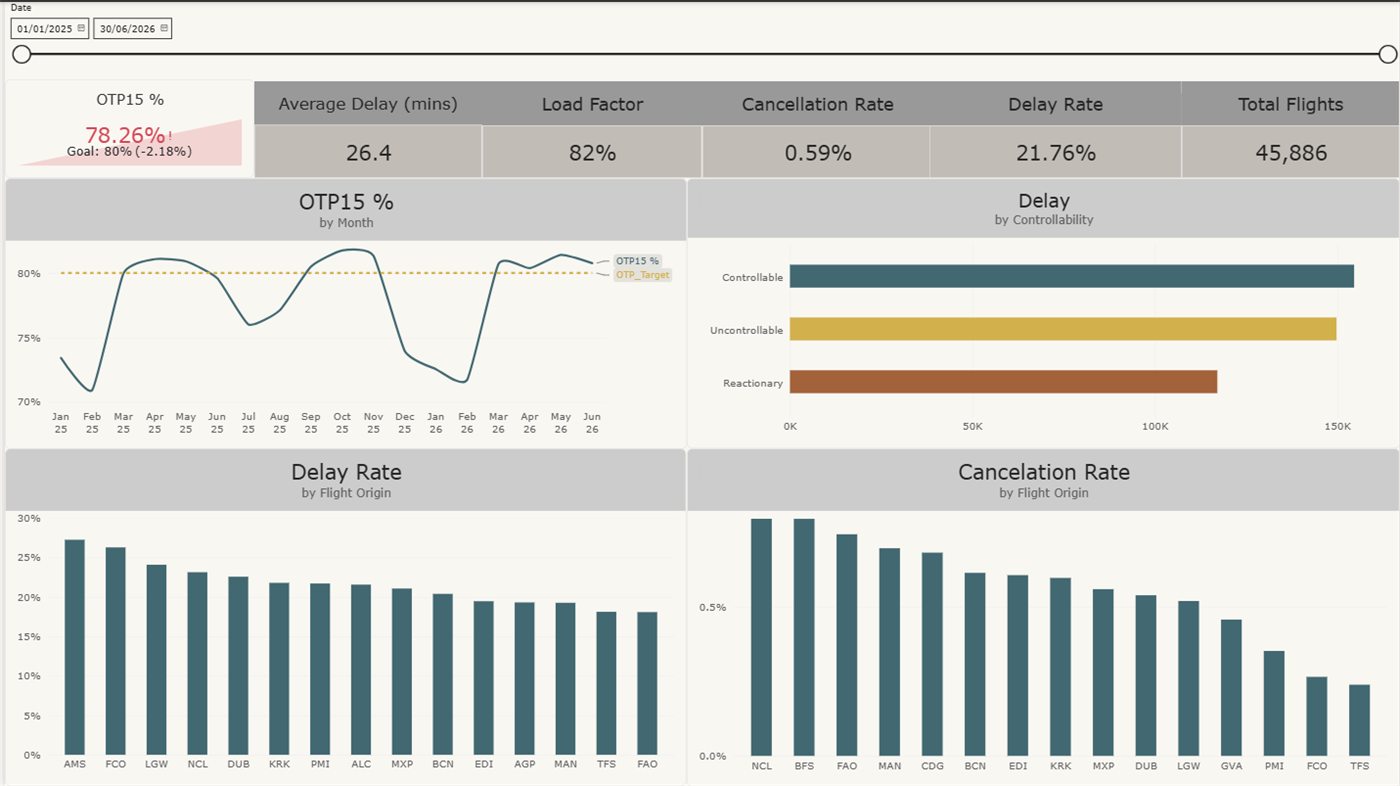
Airline departure punctuality
Eighteen months of short-haul departures for a made-up UK carrier, built to see where
punctuality actually goes. OTP15 came out at 78.26% against an 80% target, and the
delay type that happens least often turned out to cost the most each time it does.
- Power BI
- DAX
- Power Query
- Aviation
SQL · Business modelling
Driver incentive scheme modelling
Two driver bonus schemes for a busy Saturday. Option 1 costs $1,050 and Option 2
costs $2,696, and only 2 drivers would get a bonus under Option 1 and miss out under Option 2. The
more interesting find was a group of drivers neither scheme reaches.
- SQL
- Scenario modelling
- Cost analysis
SQL Server · Power BI · DAX
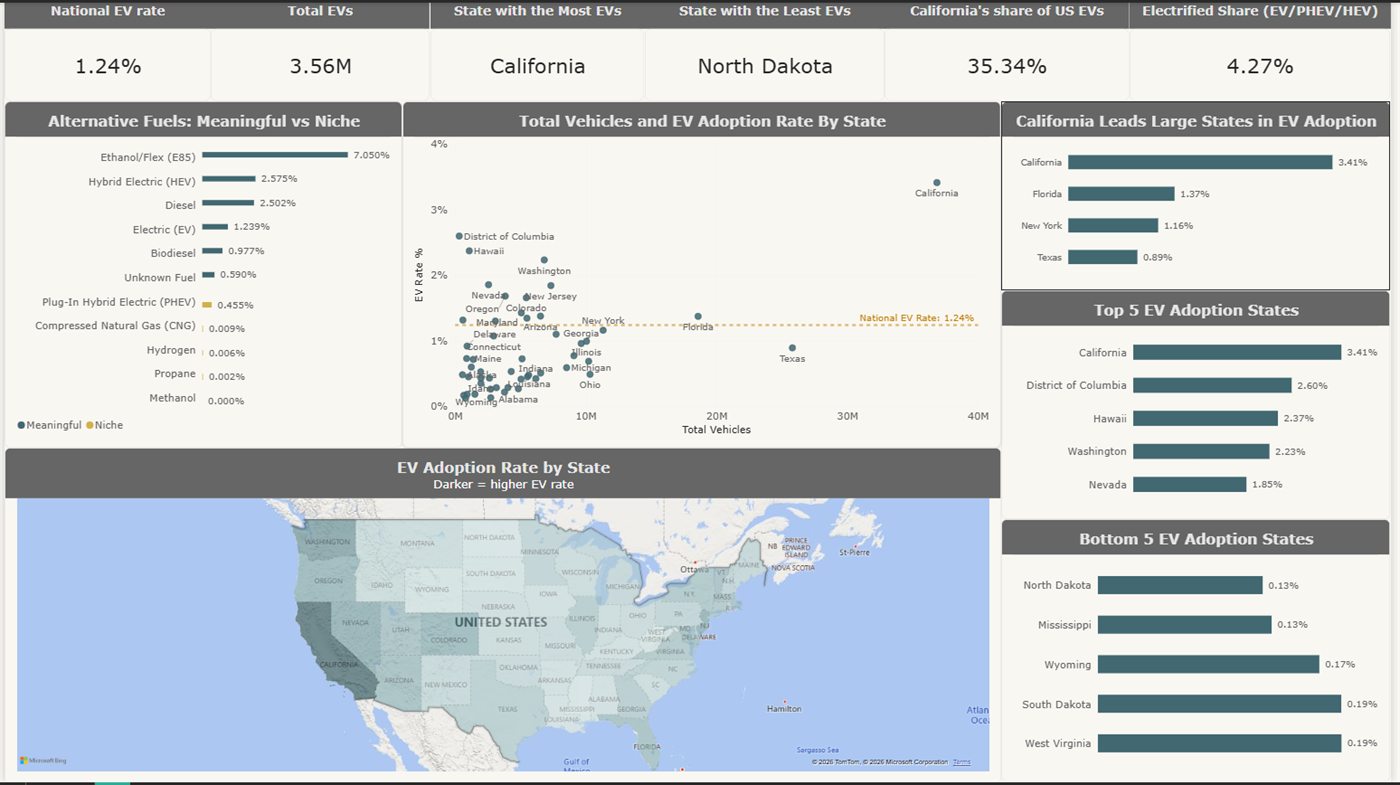
US electric vehicle adoption
Vehicle registrations for every US state, about 287 million vehicles. California has
35.3% of the country's EVs with about 13% of its cars, and Texas shows why count and
rate have to be reported together: almost as many EVs as Florida, but the lowest rate
of the four biggest fleets.
- SQL Server
- Power BI
- DAX
- Market share
SQL · Window functions
NBA trends & performance, 1996–2023
Three things everyone says about the NBA, checked against 12,000-odd player seasons.
Players with a usage rate over 30% had the best true shooting, not the worst, and part
of the drop in average height since 2015 was the league changing how it measured
players in 2019.
Power BI · DAX · Power Query
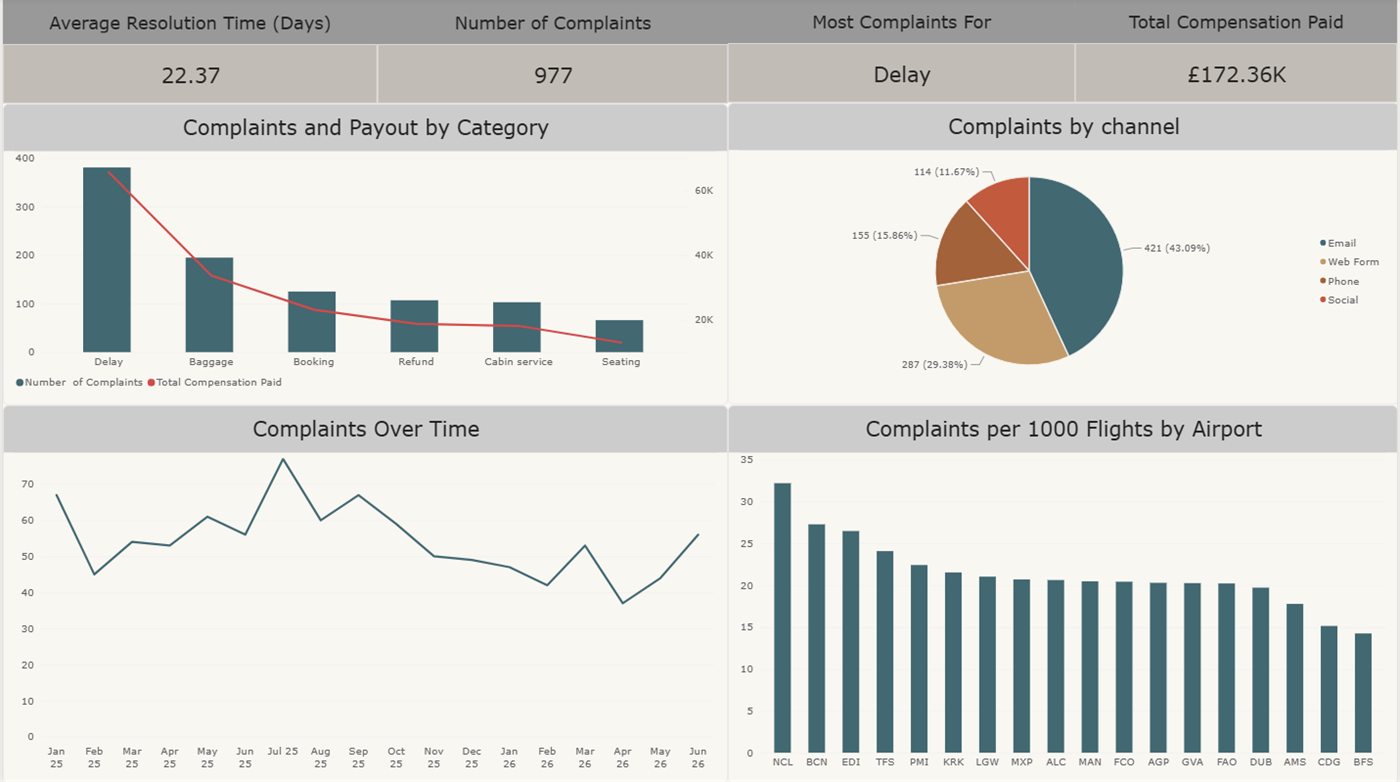
Airline customer complaints
The follow-up to the punctuality report, same carrier and same 18 months. I expected
complaints to track delay. They don't. The correlation is 0.11 and three-quarters of
complaints came from flights that left on time.
- Power BI
- DAX
- Correlation
- Aviation
SQL · Exploratory analysis
COVID-19 global analysis
Deaths and vaccinations by country, joined on country and date. The main lesson was
that no single death rate told you much, because the odds of dying if you caught it
kept falling as treatment got better. Running vaccination totals showed how uneven
the rollout was.
Power BI · DAX · Power Query
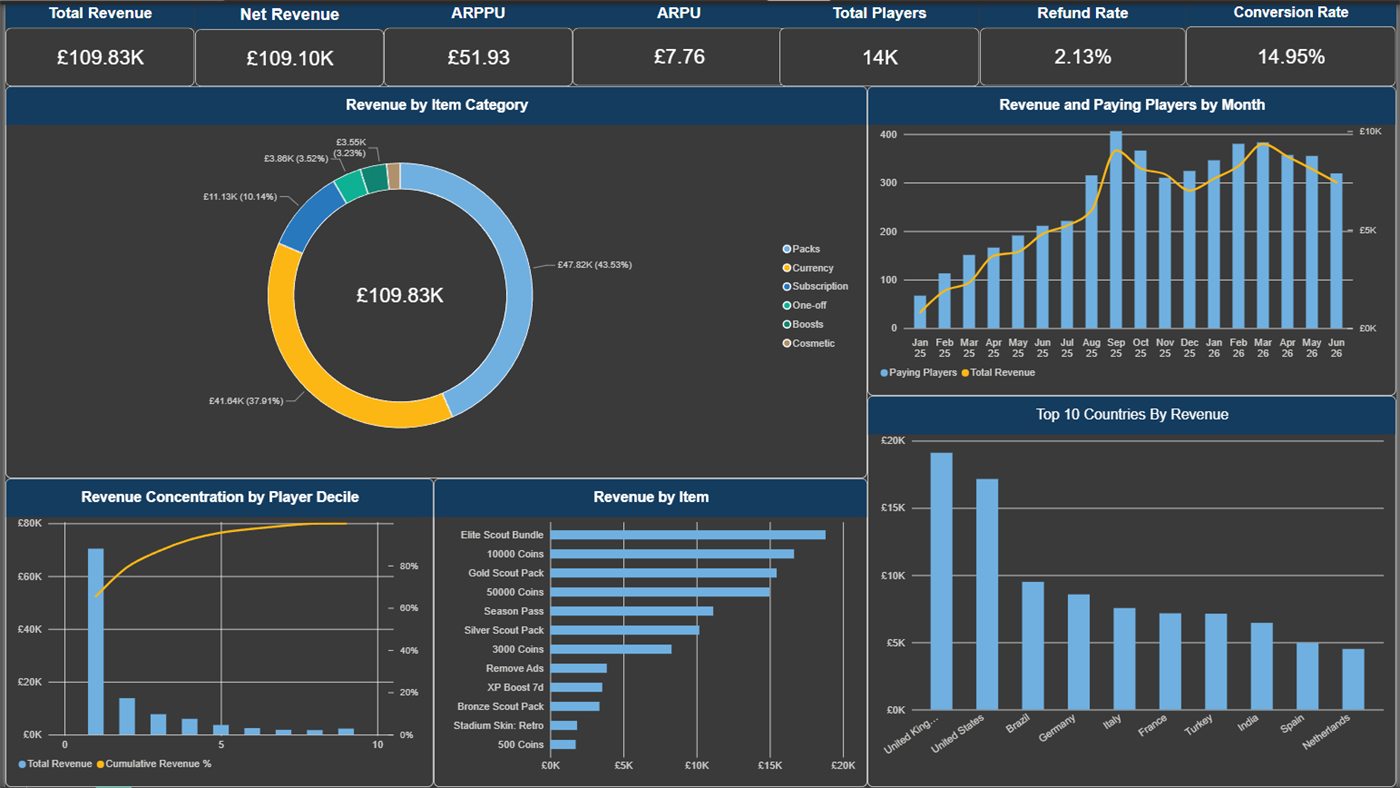
Mobile game revenue
Eighteen months of in-app purchases from a made-up football management game.
Revenue grew about twelvefold, mostly because more players started paying, and a
tenth of the paying players bring in 64.5% of it.
- Power BI
- DAX
- Pareto
- Monetisation
Excel · Power Query · Dynamic arrays
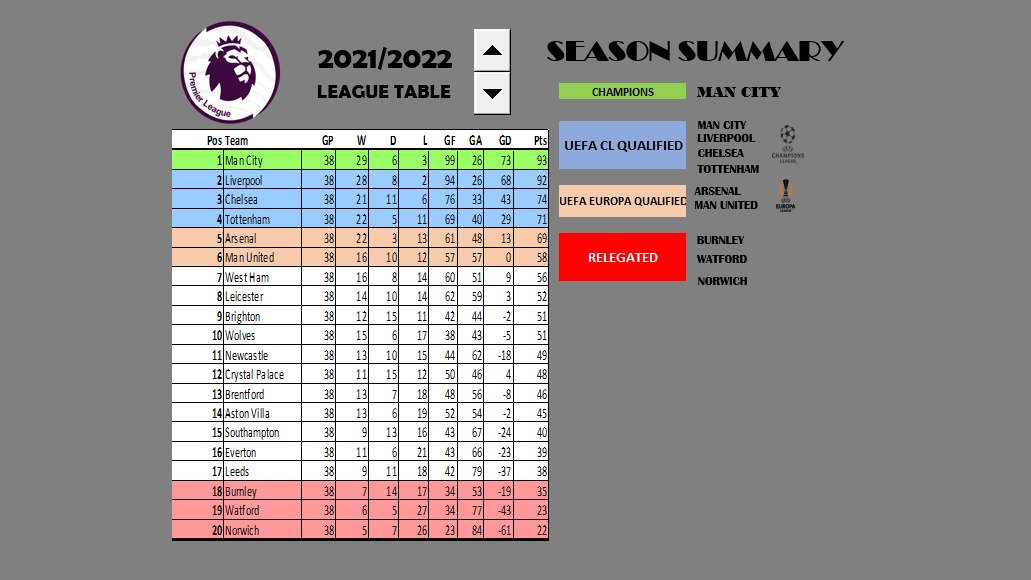
Premier League season dashboard
8,360 matches from 2000/01 to 2021/22, rebuilt into a league table for any season
you pick. My favourite find: 2020/21, played without fans, is the only season where
away teams won more games than home teams.
- Excel
- Power Query
- FILTER & XLOOKUP
- Dashboard
Pyodide · SQLite · JavaScript
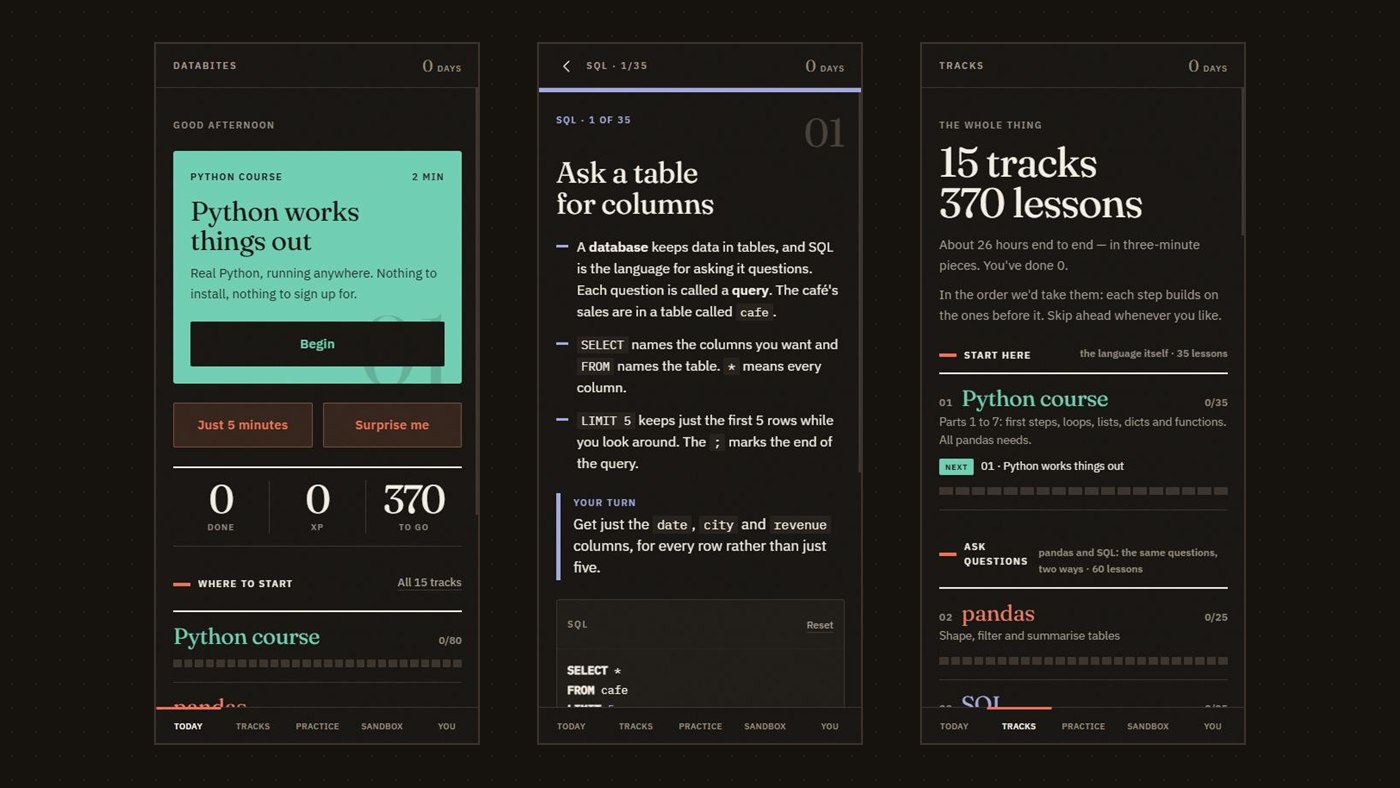
DataBites — Python, SQL and DAX in small bites
Short lessons that run in the browser with nothing to install. It started as pandas
on my phone and is now 370 lessons across Python, SQL and DAX, 139 practice
problems and PL-300 exam prep. I built it with Claude as my coding partner, because most tutorials
assume you can hold an hour of context in your head at once, and some days I can't.
No projects in that category yet.